

Бангкок- Thai AirAsia (FD), ведущий лоукостер Таиланда, управляет обширной сетью с Бангкоком (BKK), выступающей в качестве основного хаба для внутренних и международных связей.
Топ-20 самых загруженных маршрутов Thai AirAsia (FD), в которых доминируют внутренние услуги, демонстрируют сильное присутствие на рынке во всем мире. Таиланд выделяет выборочные международные направления в Юго-Восточной и Восточной Азии.
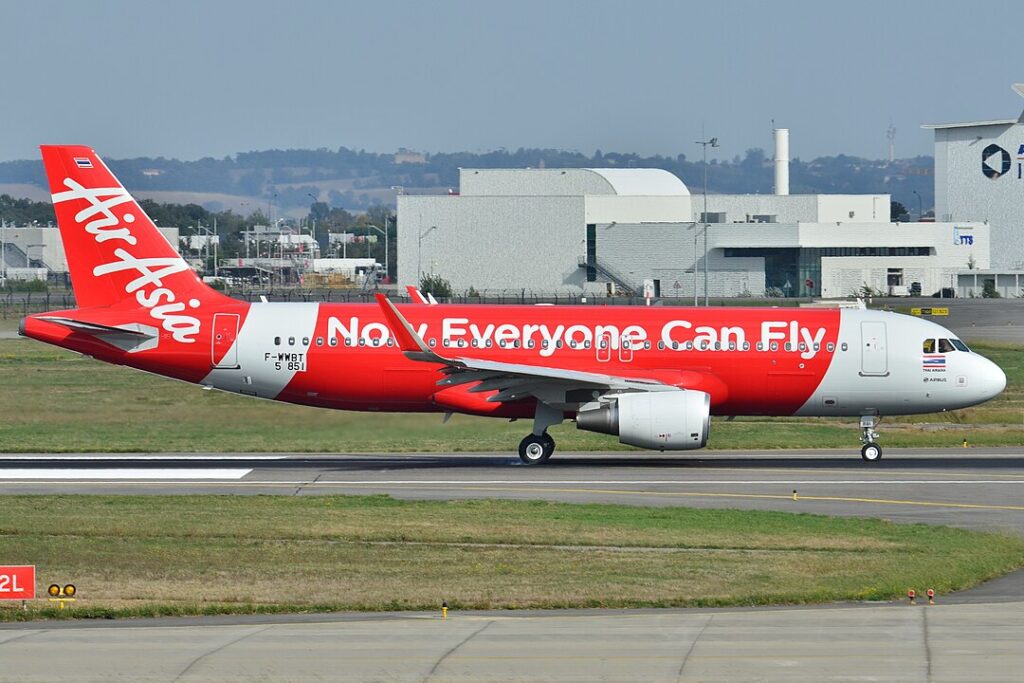 Фото: Laurent ERRERA из L'Union, Франция - DSC_8385-F-WWBT - MSN 5861, CC BY-SA 2.0, https://commons.wikimedia.org/w/index.php?curid=29837664
20 самых популярных маршрутов авиакомпании Thai AirAsia
Анализ AvBench 20 самых загруженных маршрутов Thai AirAsia (FD) дает ценную информацию о позиции перевозчика на рынке и стратегической направленности.
Данные показывают, что в сети авиакомпании доминируют операции в Бангкоке, причем все маршруты, кроме одного (Чьянгмай-Пхукет), происходят из столицы Таиланда.
Такой подход позволил Thai AirAsia сохранит значительную долю на внутреннем рынке, показывая уязвимости на некоторых международных рынках.
| 1 1 | Бангкок - Чиангмай | 4 233 333 | 39% | 1 651 000 | 5,2% |
| 2 2 | Бангкок - Пхукет | 4 476 471 | 34% | 152 000 000 | 2,5% |
| 3 | Бангкок - Hat Yai | 2 173 513 | 37% | 804 000 000 | 2,9% |
| 4.4 | Бангкок - Краби | 1 340 426 | 47% | 630 тысяч | 1,9% |
| 5 | Бангкок - Khon Kaen | 1 225 641 | 39% | 478000000 | 3,8% |
| 6.6 | Бангкок - Чианг Рай | 1 632 143 | 28% | 457 000 | 1,3% |
| 7. | Бангкок - Сурат Тани | 1,097,368 | 38% | 417,000 | 6,2% |
| 8 | Бангкок - Удон Тани | 1453 846 | 26% | 378000000 | 4,5% |
| 9 9 | Бангкок - Сингапур | 2 769 231 | 13% | 360 тысяч | -5,3% |
| 1010 | Бангкок - Гонконг | 2 618 182 | 11% | 288 тысяч | 3,4% |
| 11. | Бангкок - Накхон Си Таммарат | 925 806 | 31% | 287 тысяч | 6,1% |
| 12. | Бангкок - Накхон Фаном | 268 тысяч | 100% | 268 тысяч | 9,4% |
| 13 | Бангкок - Roi Et | 267 тысяч | 100% | 267 тысяч | 0,0% |
| 14 | Бангкок - Ubon Ratchathani | 1 140 909 | 22% | 251 000 000 | 1,9% |
| 15 | Бангкок - Phitsanulok | 425 424 | 59% | 251 000 000 | 11,3% |
| 16 | Чиангмай - Пхукет | 504 082 | 49% | 247 000 | 0,2% |
| 177 | Бангкок - Da Nang | 592 500 | 40% | 237 тысяч | 2,6% |
| 18 | Бангкок - Нан | 370,313 | 64% | 237 тысяч | -2,4% |
| 19 | Бангкок - Ho Chi Minh City | 1,072,727 | 22% | 236 тысяч | 0,4% |
| 20 | Бангкок - Макао | 418 868 | 53% | 222 000 000 | -4,2% |
1. Бангкок (БКК) - Чиангмай (CNX)
- Количество пассажиров: 4 233 333
- Доля рынка: 39%
- Пассажиры авиакомпании Thai AirAsia: 1 651 000
- Темпы роста: 5,2%
Этот востребованный внутренний маршрут соединяет столицу Таиланда с его культурным сердцем, Чиангмай. Маршрут остается одним из самых оживленных в Таиланде, пользуясь сильным туризмом и деловыми поездками.
Рост продолжается устойчивыми темпами, чему способствует рост внутреннего туризма и стабильная экономика.
2. Бангкок (БКК) - Пхукет (ХКТ)
- Количество пассажиров: 4 476 471
- Доля рынка: 34%
- Пассажиры авиакомпании Thai AirAsia: 1 522 000
- Темпы роста: 2,5%
Будучи одним из лучших туристических направлений Таиланда, Пхукет видит значительный пассажиропоток круглый год.
Однако конкуренция со стороны других перевозчиков и альтернативные варианты путешествий несколько замедляют рост доли рынка. AirAsia продолжает доминировать в сегменте лоукост, сохраняя лидирующие позиции.
3. Bangkok (BKK) - Hat Yai (HDY)
- Количество пассажиров: 2 173 513
- Доля рынка: 37%
- Пассажиры авиакомпании Thai AirAsia: 804 000
- Темпы роста: 2,9%
Этот южный маршрут Таиланда имеет решающее значение как для деловых, так и для туристов. Несмотря на умеренный рост, спрос на пассажиров остается стабильным, поддерживая общую стабильность сети.
4. Бангкок (БКК) - Краби (КБВ)
- Количество пассажиров: 1 340 426
- Доля рынка: 47%
- Пассажиры авиакомпании Thai AirAsia: 630 000
- Темпы роста: 1,9%
Привлекательность Краби как пляжного направления стимулирует пассажиропоток, но сезонные колебания влияют на ежегодный рост.
Thai AirAsia (FD) занимает доминирующее положение на этом маршруте, укрепляя свою региональную мощь.
5. Bangkok (BKK) - Khon Kaen (KKC)
- Количество пассажиров: 1 225 641
- Доля рынка: 39%
- Пассажиры авиакомпании Thai AirAsia: 478 000
- Темпы роста: 3,8%
Ключевой маршрут, обслуживающий северо-восточный Таиланд, Бангкок до Кхон Каена, поддерживает сочетание деловых и личных поездок. Рост экономической активности в регионе способствует росту пассажиропотока.
6. Bangkok (BKK) - Chiang Rai (CEI)
- Количество пассажиров: 1 632 143
- Доля рынка: 28%
- Пассажиры авиакомпании Thai AirAsia: 457 000
- Темпы роста: 1,3%
Этот маршрут обслуживает Чианг Рай, ворота в живописные ландшафты северного Таиланда. Спрос остается высоким, особенно в пиковые сезоны путешествий.
7. Бангкок (БКК) - Сурат Тани (УРТ)
- Количество пассажиров: 1 097 368
- Доля рынка: 38%
- Пассажиры авиакомпании Thai AirAsia: 417 000
- Рост в годовом исчислении: 6,2%
Сурат Тани обеспечивает доступ к Самуи и другим островам Персидского залива, что делает его жизненно важным маршрутом. Сильный рост указывает на растущий интерес к альтернативным туристическим центрам.
8. Бангкок (БКК) - Удон Тани (ЮТХ)
- Количество пассажиров: 1 453 846
- Доля рынка: 26%
- Пассажиры авиакомпании Thai AirAsia: 378 000
- Темпы роста в годовом исчислении: 4,5%
С Удоном Тани является ключевым деловым и туристическим центром вблизи границы с Лаосом, этот маршрут по-прежнему имеет решающее значение для региональной связи.
9. Бангкок (БКК) - Сингапур (СИН)
- Количество пассажиров: 2 769 231
- Доля рынка: 13%
- Пассажиры авиакомпании Thai AirAsia: 360 000
- Темпы роста в годовом исчислении: -5,3%
Снижение показателей подчеркивает сильную конкуренцию в секторе Бангкок (BKK) - Сингапур (SIN), что потенциально влияет на долю рынка.
10. Бангкок (БКК) - Гонконг (ХКГ)
- Количество пассажиров: 2 618 182
- Доля рынка: 11%
- Пассажиры авиакомпании Thai AirAsia: 288 000
- Темпы роста: 3,4%
Несмотря на то, что это крупный международный маршрут, Thai AirAsia сталкивается с интенсивной конкуренцией со стороны авиакомпаний с полным спектром услуг и бюджетом, что влияет на темпы роста.
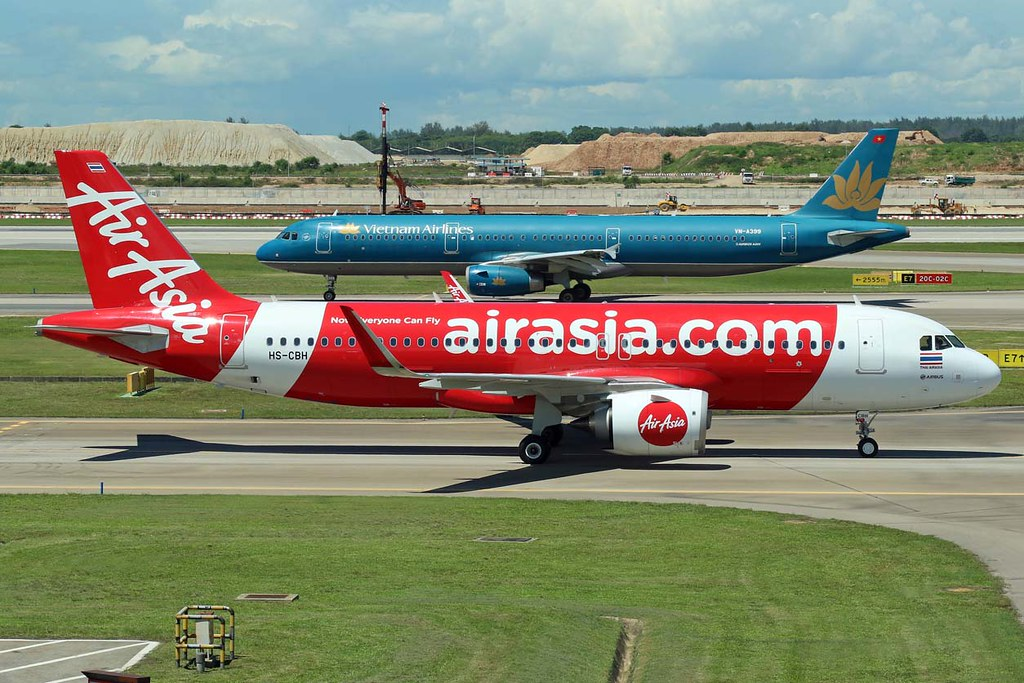 Фото: HS-CBH Airbus A320-251N Thai AirAsia cn 8052 | Dreamcatcher-68 | Flickr
11. Bangkok (BKK) - Nakhon Si Thammarat (NST)
- Количество пассажиров: 925 806
- Доля рынка: 31%
- Пассажиры авиакомпании Thai AirAsia: 287 000
- Темпы роста: 6,1%
Сильный региональный спрос стимулирует рост этого маршрута, подчеркивая роль Thai AirAsia в соединении второстепенных городов.
12. Bangkok (BKK) - Nakhon Phanom (KOP)
- Количество пассажиров: 268 000
- Доля рынка: 100%
- Пассажиры авиакомпании Thai AirAsia: 268 000
- Темпы роста: 9,4%
Обладая монополией на этот маршрут, Thai AirAsia продолжает доминировать в региональных авиаперевозках.
13. Bangkok (BKK) - Roi Et (ROI)
- Количество пассажиров: 267 000
- Доля рынка: 100%
- Пассажиры авиакомпании Thai AirAsia: 267 000
- Темпы роста: 0,0%
Без конкуренции, Количество пассажиров Thai AirAsia остается стабильным, хотя рост застопорился.
14. Bangkok (BKK) - Ubon Ratchathani (UBP)
- Количество пассажиров: 1 140 909
- Доля рынка: 22%
- Пассажиры авиакомпании Thai AirAsia: 251 000
- Темпы роста: 1,9%
Этот маршрут играет жизненно важную роль в соединении Бангкока с экономической деятельностью северо-восточного Таиланда.
15. Bangkok (BKK) - Phitsanulok (PHS)
- Количество пассажиров: 425 424
- Доля рынка: 59%
- Пассажиры авиакомпании Thai AirAsia: 251 000
- Темпы роста: 11,3%
Один из самых быстрорастущих внутренних маршрутов, отражающий растущий спрос на центральное сообщение с Таиландом.
16. Чиангмай (CNX) - Пхукет (HKT)
- Количество пассажиров: 504 082
- Доля рынка: 49%
- Пассажиры авиакомпании Thai AirAsia: 247 000
- Темпы роста в годовом исчислении: 0,2%
Несмотря на сезонные колебания, этот ключевой внутренний маршрут сохраняет устойчивую долю рынка.
17. Bangkok (BKK) - Da Nang (DAD)
- Количество пассажиров: 592 500
- Доля рынка: 40%
- Пассажиры авиакомпании Thai AirAsia: 237 000
- Темпы роста в годовом исчислении: 2,6%
Рост остается стабильным, подчеркивая Дананг как развивающееся направление в Юго-Восточной Азии.
18. Bangkok (BKK) - Nan (NNT)
- Количество пассажиров: 370 313
- Доля рынка: 64%
- Пассажиры авиакомпании Thai AirAsia: 237 000
- Темпы роста в годовом исчислении: -2,4%
Небольшое снижение свидетельствует о колебаниях спроса на этот региональный маршрут.
19. Bangkok (BKK) - Ho Chi Minh City (SGN)
- Количество пассажиров: 1 072 727
- Доля рынка: 22%
- Пассажиры авиакомпании Thai AirAsia: 236 000
- Темпы роста в годовом исчислении: 0,4%
Конкурентный международный рынок сохраняет скромные темпы роста для этой связи между Таиландом и Вьетнамом.
20. Бангкок (БКК) - Макао (МФМ)
- Количество пассажиров: 418 868
- Доля рынка: 53%
- Пассажиры авиакомпании Thai AirAsia: 222 000
- Темпы роста в годовом исчислении: -4,2%
Снижение спроса предполагает изменение предпочтений в поездках или усиление конкуренции на этом международном маршруте.
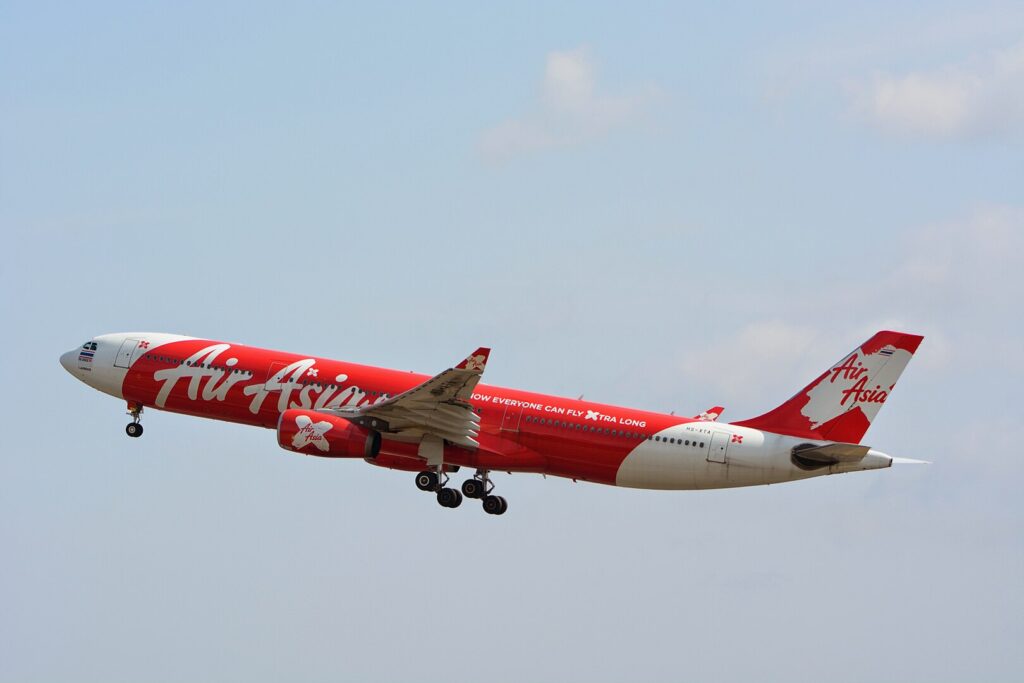 Фото: Masakatsu Ukon - Thai AirAsia X, Airbus A330-300 HS-XTA NRT, CC BY-SA 2.0, https://commons.wikimedia.org/w/index.php?curid=42014140
Изменение доли рынка
Авиационная отрасль очень конкурентоспособна, и колебания доли рынка неизбежны.
Последние данные Thai AirAsia о 20 самых загруженных маршрутах показывают как положительные, так и отрицательные тенденции, на которые влияют такие факторы, как растущий спрос на поездки, операционные корректировки и конкурентное давление.
Эффективные маршруты
Несколько маршрутов сохранили или расширили свое присутствие на рынке. В частности:
- Бангкок-Чиан Май Остается самый большой маршрут, с 1,65 млн. пассажиров и Рост на 5,2%.
- Бангкок-Сурат Тани Видел, как 6,2% рост в прошлом году, что свидетельствует о росте спроса на поездки в южный регион.
- Бангкок-Накхон Фаном записанный в Самые высокие темпы роста - 9,4%Возможно, из-за возросшего интереса к туризму.
- Бангкок-Пхитсанулок Имел впечатляющий Рост на 11,3%Самый высокий среди внутренних маршрутов.
Маршруты, столкнувшиеся с падением
На некоторых маршрутах наблюдается снижение пассажиропотока, что свидетельствует о проблемах спроса или стратегических сдвигах:
- Бангкок-Сингапур уменьшенный -5,3%Это означает усиление конкуренции или снижение спроса.
- Чианг Май-Пхукет заброшенный -6,5%Возможно, из-за сезонных колебаний или альтернативных вариантов путешествий.
- Бангкок-Нан и Бангкок-Макао видел снижение -2,4% и -4,2%соответственно, что свидетельствует о более слабом спросе.
Сдвиги на рынке отражают приоритеты авиакомпаний. Thai AirAsia владеет значительными долями на некоторых внутренних маршрутах. Бангкок-Пхитсанулок (59%) и Бангкок-Нан (64%)Это свидетельствует о доминировании в этих сегментах.
Однако более низкие доли на международных маршрутах, таких как: БангкокГонконг (11%) и Бангкок-Сингапур (13%), предлагают проблемы в конкуренции с перевозчиками полного цикла.
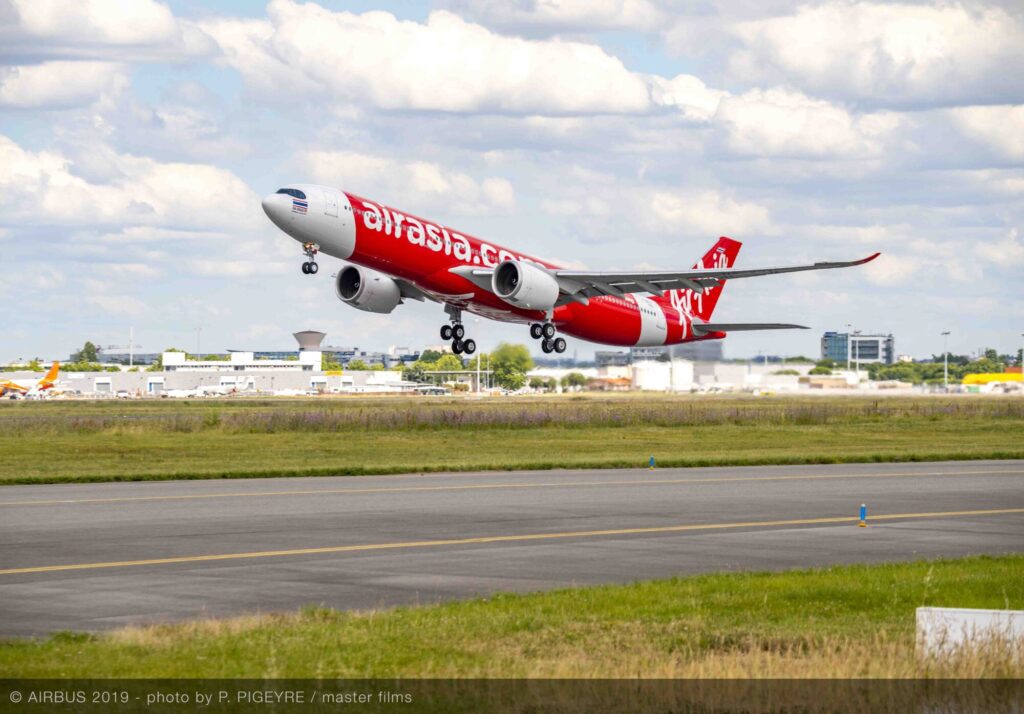
 Фото: Melvin Loi | Flickr
Будущие тенденции
В то время как пассажиропоток является ключевым показателем, авиакомпании часто фокусируются на оптимизации доходов. Thai AirAsia может корректировать пропускную способность на неэффективных маршрутах или вводить промо-тарифы для восстановления доли рынка.
Рост в таких направлениях, как Бангкок-Накхон Фаном (9,4%) Это говорит о том, что региональная экспансия остается приоритетом.
Между тем, снижение международных маршрутов с высоким трафиком может подтолкнуть авиакомпанию к переосмыслению стратегий ценообразования и партнерских отношений.
Нижняя линия
Самые загруженные маршруты Thai AirAsia отражают динамичный характер авиационной отрасли. В то время как некоторые маршруты продолжают процветать, другие сталкиваются с неудачами, на которые влияют конкуренция, оперативные стратегии и предпочтения путешественников.
Способность авиакомпании адаптироваться будет определять ее долгосрочные рыночные позиции.
Оставайтесь с нами. Следуйте за нами в социальных сетях для последних обновлений.
Присоединяйтесь к нам в Telegram Group для последних обновлений авиации. Следуйте за нами в Google News
AirAsia планирует запустить новые рейсы в Европу и США к 2030 году
Топ-20 самых оживленных маршрутов Тайской AirAsia, No5 вас удивит! Впервые появился на Aviation A2Z.


![Idą osadnicy! Życie w Palestynie na swojej-nieswojej ziemi [korespondencja z Zachodniego Brzegu]](https://cdn.oko.press/cdn-cgi/image/trim=595;0;635;0,width=1200,quality=75/https://cdn.oko.press/2026/05/AP24123331516065.jpg)