
Рынок RINO: рецессия только по названию ?
ИПЦ завершен? Проверь!
ATH Equity? Проверь!
Американские фондовые рынки остаются устойчивыми, подкрепленными сильными перекрестными потоками активов.
Митинг, похоже, продлится до Дня труда. за рулем:
Надежная корпоративная прибыль в целом превышает ожидания
Разнообразное участие корпораций, учреждений и розничных инвесторов
Концентрированное лидерство в области ИИ, большой капитализации, качества и технических названий
Тем не менее, импульс может исчезнуть в сентябре. исторически самый слабый месяц на фоне сезонности и возобновления взаимодействия с инвесторами после лета.
Как теперь объясняет Скотт Рубнер (бывший гуру Goldman) со своего места в Citadel Securities: Это рынок #RINO, рецессия только по названию....
I. Citadel Securities On-the-Ground Sentiment
Активность клиентов остается на рекордно высоком уровне на фондовом рынке:
Денежные акции: Розничные чистые покупатели 15 из последних 17 недель
Розничные варианты: 15-недельная серия покупок16 из последних 17 недель
Институциональные варианты: Бычий тон в 5 из последних 6 недель
Второй. Стратегические дебаты на этой неделе: когда деньги возвращаются в активы риска?
Поскольку ICI отчитывается о денежном рынке AUM на уровне $7,15 трлн (по сравнению с $3,63 трлн в начале 2020 года), ключевым вопросом становится: какой уровень доходности будет стимулировать перераспределение в рисковые активы, если ФРС изменит политику?
Сдвиг в 10% (~ $700 млрд) может активизировать акции, приносящие дивиденды, высококачественный кредит и рисковые активы, такие как «эффект января» (сезонная аномалия, когда акции имеют тенденцию к росту).
Q4 Вращение Смотри: По мере того, как ожидания по ставкам смягчаются, этот «сухой порошок» может привести к росту следующих 493 акций в S&P 500.
Активы денежного рынка (триллион) против США 3-месячная доходность денежного рынка (%)
Январь 2020 — август 2025
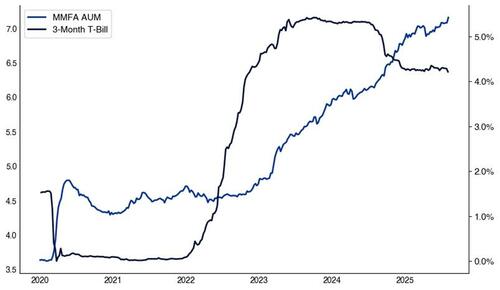
Источник: ICI, как сообщает Bloomberg и составляется Citadel Securities, по состоянию на 12.08.25. Цифры приведены только для иллюстративных целей. Прошлые показатели эффективности не гарантируют будущих результатов.
Исторический аналог: В 2010 году активы денежного рынка упали на 27% по мере снижения доходности, предшествуя ротации на акции.
Активы денежного рынка (триллион) против США 3-месячная доходность денежного рынка (%)
Январь 2005 — январь 2015
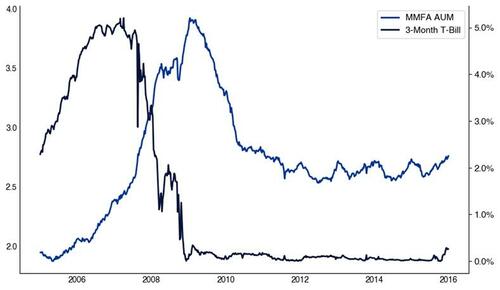
Источник: ICI, как сообщает Bloomberg и составляется Citadel Securities, по состоянию на 12.08.25. Цифры приведены только для иллюстративных целей. Прошлые показатели эффективности не гарантируют будущих результатов.
III. Сезонные часы
Сентябрьская настройка
3 сентября часто отмечается месячный максимум для SPX с 1928 года.
День после работы Участие в FOMO обычно исчезает, ограничивая поведение покупки.
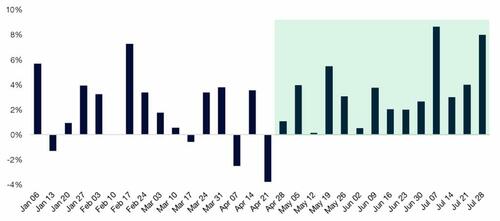
SPX и NDX исторически показывают силу августа, за которой следует слабость сентября.
SPX 500 Ежемесячное исполнение
1928 - Сегодня
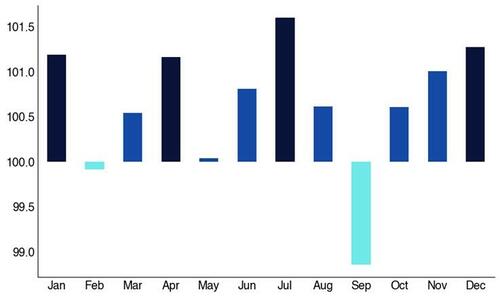
Источник: Bloomberg, составленный Citadel Securities, по состоянию на 12.08.25. Цифры приведены только для иллюстративных целей. Прошлые показатели эффективности не гарантируют будущих результатов.
SPX 500 Daily Performance Quilt
1928 - Сегодня
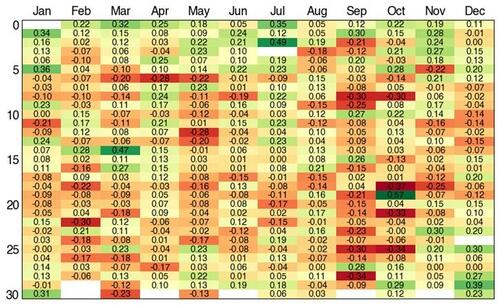
Источник: Bloomberg, составленный Citadel Securities, по состоянию на 12.08.25. Цифры приведены только для иллюстративных целей. Прошлые показатели эффективности не гарантируют будущих результатов.
IV. Розничная позиционирование
1. Розничные денежные акции Citadel Securities: Чистые покупатели в 15 из последних 17 недель, После мягкого апреля.
Розничные денежные акции - чистое понятие по неделям
Звук Dev January - август 2025
Источник: Citadel Securities, по состоянию на 12.08.25. Цифры приведены только для иллюстративных целей. Прошлые показатели эффективности не гарантируют будущих результатов.
2. Текущая сила с 19 месяцами чистого условного и покупки акций.
3. Динамика сезонности розничных денежных средств Citadel Securities основана на данных за август 2017 года - июль 2025 года.
Июнь и июль = Сильный
Август - медленнее
Сентябрь - самый слабый
Розничная наличность - доля чистой номинальной по месяцам
1 августа 2017 — 31 июля 2025
Источник: Citadel Securities, по состоянию на 8/5/25. Цифры приведены только для иллюстративных целей. Прошлые показатели эффективности не гарантируют будущих результатов.
V. Волатильность и позиционирование вариантов
4. Розничные опции Июль 2025 года установил новый ежемесячный рекорд по объему в Citadel Securities.
Розничные опционы - среднесуточный объем по месяцам
Нормализовано до января 2020 года
Источник: Citadel Securities, по состоянию на 12.08.25. Цифры приведены только для иллюстративных целей. Прошлые показатели эффективности не гарантируют будущих результатов.
5. Citadel Securities покупает Streak
15-недельная серия покупок и 25 из последних 27 торговых дней.
Пятничная активность достигла 99-го процентиля, что на 41% выше 12-месячного показателя.
Розничные опции - Put / Call Direction Соотношение по неделям
Январь-июль 2025
Источник: Citadel Securities, по состоянию на 12.08.25. Цифры приведены только для иллюстративных целей. Прошлые показатели эффективности не гарантируют будущих результатов.
6. Бычьи розничные опционы Citadel Securities Streak Watch
6-я самая длинная серия бычьих опционов с 2020 года
Средняя продолжительность топ-5 полос составляет 18 недель Комната для рабочего дня вверх ногами?
Самый длинный розничный еженедельный опцион на покупку полос на рекорде с 2020 года.
# недели
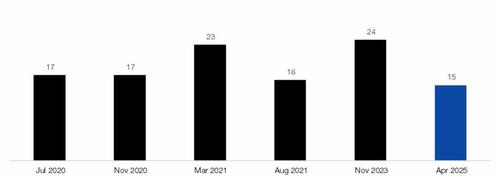
Источник: Citadel Securities, по состоянию на 8/5/25. Цифры приведены только для иллюстративных целей. Прошлые показатели эффективности не гарантируют будущих результатов.
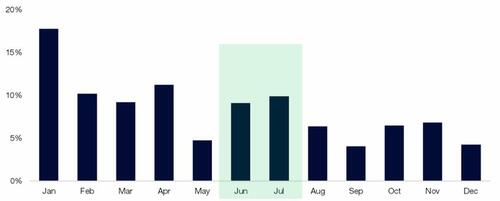
7. Сезонное падение впереди?
Объем розничных опционов Citadel Securities обычно уменьшается в сентябре.
Розничные опционы - Доля объема контракта по месяцам
Январь 2020 — декабрь 2024
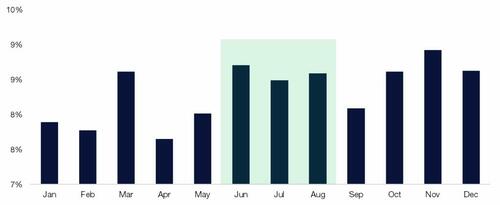
Источник: Citadel Securities, по состоянию на 8/5/25. Цифры приведены только для иллюстративных целей. Прошлые показатели эффективности не гарантируют будущих результатов.
8. Citadel Securities институциональные опционы
Бычьи 5 из последних 6 недель, достигая пика в 89-й процентиль. Обратите внимание, что клиенты Institutional Options перешли с медвежьего на бычье в прошлом месяце.
Институциональные опционы - Коэффициент направления вызова/запуска по неделям
Январь-август 2025
Источник: Citadel Securities, по состоянию на 12.08.25. Цифры приведены только для иллюстративных целей. Прошлые показатели эффективности не гарантируют будущих результатов.
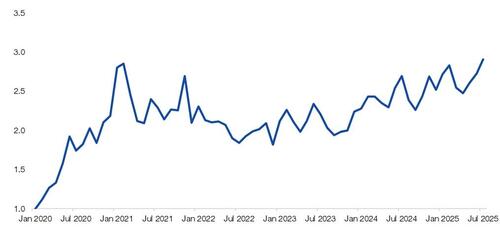
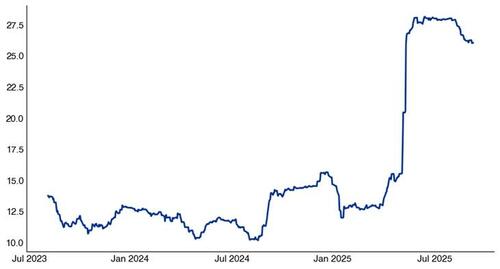
9. Тенденция волатильности: Реализованный vol продолжает падать. VIX на момент набора текста = 15.20
3 месяца: 26
1 месяц: 9
1 неделя: 12
SPX 3-месячная волатильность
Август 2023 — август 2025
Источник: Bloomberg, составленный Citadel Securities, по состоянию на 12.08.25. Цифры приведены только для иллюстративных целей. Прошлые показатели эффективности не гарантируют будущих результатов.
VI. Корпоративная прибыль и пассивная динамика потока
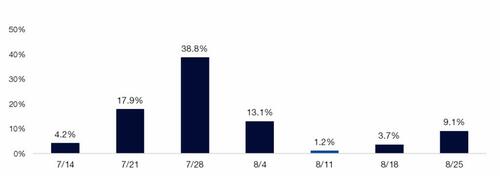
10. Q2 Прибыль: 75,2% рыночной капитализации SPX.
SPX рынок Отчетность за неделю
Q2 Заработок
Источник: Bloomberg, составленный Citadel Securities, по состоянию на 8/5/25. Цифры приведены только для иллюстративных целей. Прошлые показатели эффективности не гарантируют будущих результатов.
11. Рост корпоративных выкупов
По данным Birinyi Associates, американские корпорации объявили о разрешении YTD на сумму 983 миллиарда долларов, что делает его лучшим началом года в истории. Кроме того, темпы корпоративных казней составляют 1,1 триллиона долларов, что также установило бы рекорд.
Американские компании объявили о выкупе акций на общую сумму $166 млрд в прошлом месяце, что является самым высоким значением доллара за июль. Предыдущий рекорд составлял 88 миллиардов долларов в июле 2006 года.
12. 2025. Корпоративный Ежедневный поток математика$1,1 трлн за 251 торговый день $4,4 млрд в день Спрос на акции, по данным Birinyi Associates. Август исторически является одним из лучших месяцев года для казней.
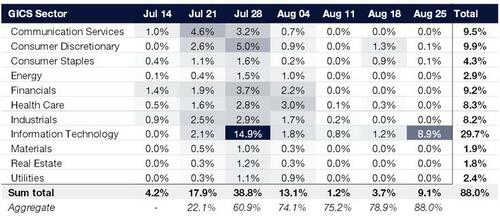
13. Отраслевая отчетность завершается, заканчивая Nvidia 8/27.
Сектор SPX GICS по рыночной капитализации
График отчетности о доходах
Источник: Bloomberg, составленный Citadel Securities, по состоянию на 12.08.25. Цифры приведены только для иллюстративных целей. Прошлые показатели эффективности не гарантируют будущих результатов.
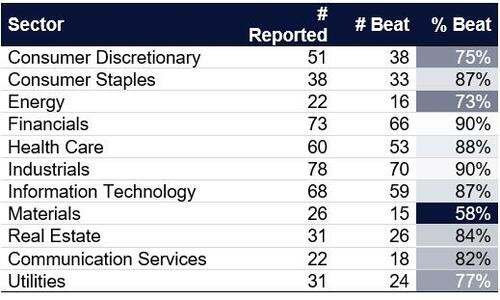
14. Q2 EPS Рост: +11,4% против 5% - самый сильный с 2 квартала 2021 года
- По данным Bloomberg, показатель EPS Q2 на 81% превышает средний показатель за 10 лет в 74%.
SPX Отчетность о доходах
По состоянию на 12 августа 2025 года
Источник: Bloomberg, составленный Citadel Securities, по состоянию на 12.08.25. Цифры приведены только для иллюстративных целей. Прошлые показатели эффективности не гарантируют будущих результатов.
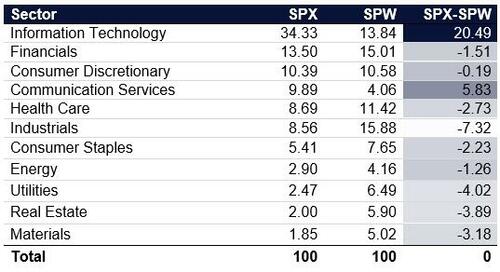
Оригинальное название: Concentration = Прибыль бьет → пассивные притоки → ценовой импульс.
Секторальная концентрация Наблюдения:
Вот 11 секторов S&P 500 GIC для индекса рыночной капитализации S&P 500 («SPX») и равновзвешенного индекса S&P 500 («SPW»).
Технический взвешивание в SPX34,3% против 13,8% в SPW +20,5% распространение
11 секторов S&P 500 по рыночной капитализации SPX %:
Источник: Bloomberg, составленный Citadel Securities, по состоянию на 12.08.25. Цифры приведены только для иллюстративных целей. Прошлые показатели эффективности не гарантируют будущих результатов.
Эта концентрация усиливает пассивные потоки в более узкую полосу акций; это приводит к «Великолепному 7» против оставшихся 493.
Полупроводники: 13,7% (SPX) против 3,9% (SPW)
Программное обеспечение: 11,6% (SPX) против 3,9% (SPW)
? Эта узкая широта в топовых названиях, создала более частые ветры и сдавливает короткую ногу парной торговли.
Топ-12 отраслей S&P 500 GIC по рыночной капитализации SPX %:
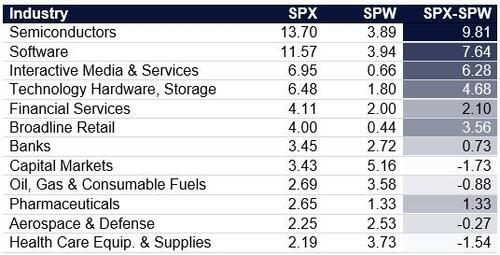
Источник: Bloomberg, составленный Citadel Securities, по состоянию на 12.08.25. Цифры приведены только для иллюстративных целей. Прошлые показатели эффективности не гарантируют будущих результатов.
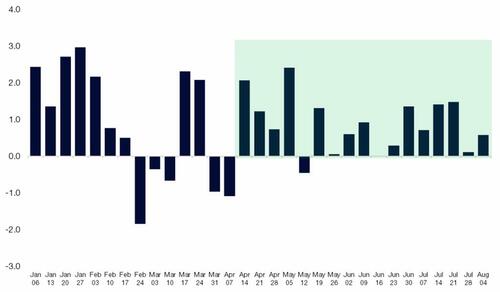
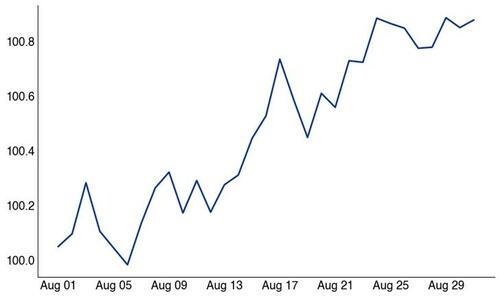
15. Август Позитивная политика
Пик S&P 500 приходится на 3 сентября 1928 года.
Последняя неделя августа часто совпадает с низким позиционированием из-за отпусков, вечеринок BBQ, что способствует дрейфу вверх в акциях, особенно в условиях низкого объема.
SPX Август Daily Performance
С 1928 года
Источник: Bloomberg, составленный Citadel Securities, по состоянию на 8/5/25. Цифры приведены только для иллюстративных целей. Прошлые показатели эффективности не гарантируют будущих результатов.
NDX Август Daily Performance
С 1985 года
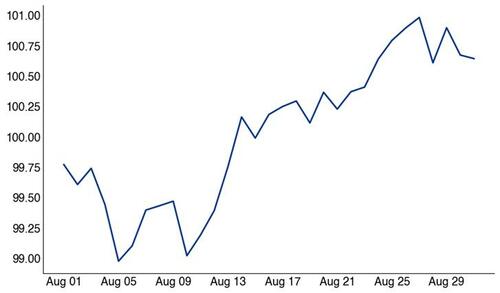
Источник: Bloomberg, составленный Citadel Securities, по состоянию на 8/5/25. Цифры приведены только для иллюстративных целей. Прошлые показатели эффективности не гарантируют будущих результатов.
VII. Институциональное позиционирование и систематическое повторное использование
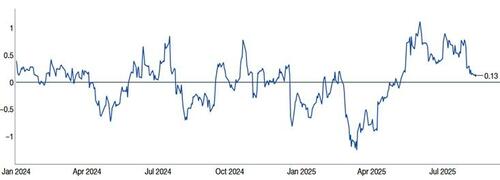
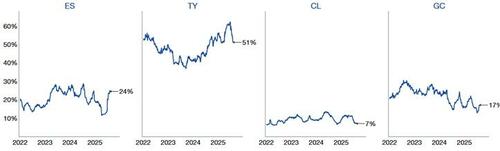
16. CTA: Мы оцениваем, что последователи тренда в настоящее время почти полностью раскрыты в конце августа. предлагатьограниченный постепенный рост. Наша модель показывает, что эта когорта больше не добавляет экспозиции на текущих уровнях.
Акционерное общество США CTA позиционирование
Январь 2024 — июль 2025
Источник: Citadel Securities, по состоянию на 12.08.25. Цифры приведены только для иллюстративных целей. Прошлые показатели эффективности не гарантируют будущих результатов.
US CTA сигналы
Январь 2024 — июль 2025
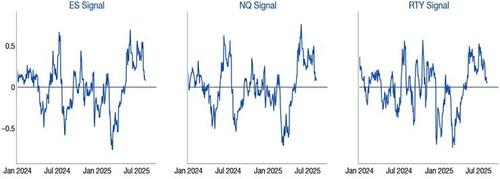
Источник: Citadel Securities, по состоянию на 12.08.25. Цифры приведены только для иллюстративных целей. Прошлые показатели эффективности не гарантируют будущих результатов.
17. CFTC Чистая длинаПродолжается рост позиционирования до исторического уровня.
CFTC S&P 500 консолидированный % Long
Январь 2022 — июль 2025
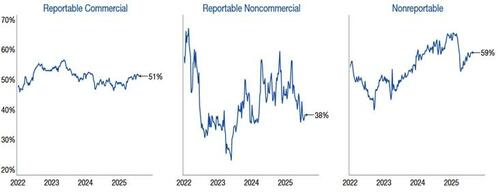
Источник: COT report, as compiled by Citadel Securities, as of 8/11/25. Цифры приведены только для иллюстративных целей. Прошлые показатели эффективности не гарантируют будущих результатов.
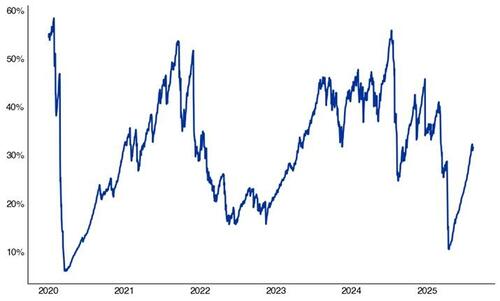
18. Стратегии Vol-Control, которые принимают сигналы от реализованного рынка волатильности, уже значительно увеличили воздействие.
Целевой уровень риска 5%: 32% (по сравнению с 10% в апреле)
Цель экспозиции с 5% контролем риска
Уровень экспозиции с 2020 года
Источник: Bloomberg, составленный Citadel Securities, по состоянию на 12.08.25. Цифры приведены только для иллюстративных целей. Прошлые показатели эффективности не гарантируют будущих результатов.
19. Целевая стратегия волатильности 10% в настоящее время подвержена воздействию 63% (по сравнению с 20% в апреле)
Цель экспозиции с 10% контролем риска
Уровень экспозиции с 2020 года
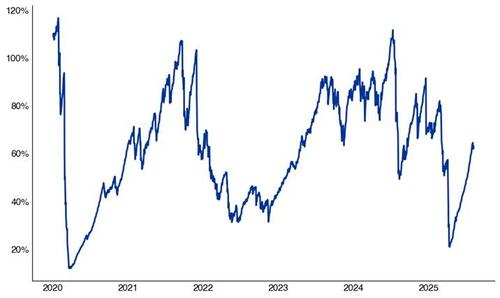
Источник: Bloomberg, составленный Citadel Securities, по состоянию на 12.08.25. Цифры приведены только для иллюстративных целей. Прошлые показатели эффективности не гарантируют будущих результатов.
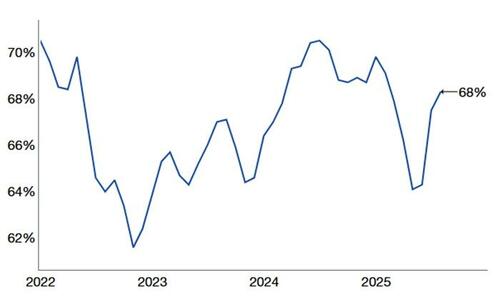
20. Стратегии паритета рисков, обусловленные волатильностью кросс-активов, в настоящее время удерживают экспозицию акций вблизи их 3-летнего среднего уровня в 25%.
Систематическое позиционирование остается повышенным → следите за движениями волатильности, так как перекосы потоков движутся вниз.
Воздействие паритета риска
Январь 2022 - июль 2025
Источник: Citadel Securities, по состоянию на 8/5/25. Цифры приведены только для иллюстративных целей. Прошлые показатели эффективности не гарантируют будущих результатов.
21. Нормализация чувствAAII распределяет обратно к историческим средним значениям → меньше по сравнению с одними только настроениями.
Распределение запасов AAII (%)
Январь 2022 - июль 2025
Источник: AAII, как сообщает Bloomberg и составляется Citadel Securities, по состоянию на 12.08.25. Цифры приведены только для иллюстративных целей. Прошлые показатели эффективности не гарантируют будущих результатов.
GMI - сентябрьский тактический контрольный список
Системные стратегии (CTA/Vol-Control) при максимальном воздействии Заголовок и экономические риски
Сентябрь - самый слабый месяц SPX (с 1928)
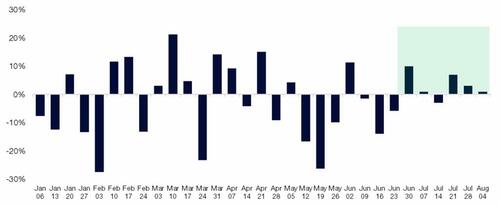
Волатильность растет Исторически в сентябре (с 1990 года)
VIX Августовское ежемесячное выступление
С 1990 года
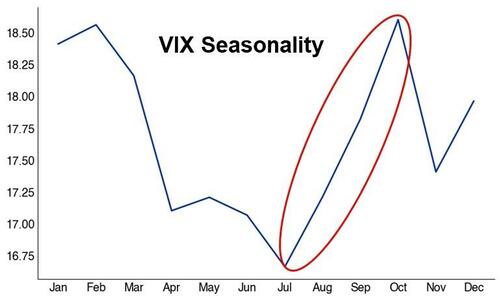
Источник: Citadel Securities, по состоянию на 8/5/25. Цифры приведены только для иллюстративных целей. Прошлые показатели эффективности не гарантируют будущих результатов.
Участие в розничной торговле уменьшается по наличным деньгам и опционам
Циклы и высокая бета могут означать возврат
Анти-импульс Риск ротации остается высоким
Читать далее здесь...
Тайлер Дерден
Свадьба, 08/13/2025 - 14:40

![Трамп устроил шоу у Белого дома. Навроцкий наблюдал за всем [ВИДЕО]](https://cdn.galleries.smcloud.net/thumbs/gf-4f7H-YAqB-vvDe_donald-trump-15-j.jpg)