Даллас- Анализ 20 самых загруженных маршрутов Southwest Airlines (WN) показывает смешанную производительность по всей сети.
Данные AvBench за 3 квартал 2024 года показывают, что Southwest Airlines (WN) сталкивается с различными уровнями производительности на своих 20 самых загруженных маршрутах, с заметной силой на рынках Калифорнии, несмотря на широко распространенное снижение в годовом исчислении.
 Источник: Clément Alloing
20 самых оживленных маршрутов Юго-Запада
Southwest Airlines (WN) демонстрирует значительное присутствие на рынке по основным коридорам США, особенно в Калифорнии и западных штатах. Данные показывают:
- Общее количество пассажиров, перевезенных по 20 маршрутам: 19 220 000
- Доля рынка от 21% до 90%
- Преимущественно негативные 12-месячные тенденции роста
| 1 1 | Лос-Анджелес-Сакраменто | 2 133 000 | 90% | 1,919,700 | 1,5% | -3,7% |
| 2 2 | Лос-Анджелес-Сан-Хосе | 1,702 тыс. | 84% | 1,429,680 | 0,5% | -4,2% |
| 3 | Лос-Анджелес-Сан-Франциско | 2 523 000 | 47% | 1 185 810 | -2,4% | -6,5% |
| 4.4 | Лас-Вегас-Лос-Анджелес | 1 994 000 | 50% | 997 000 | 0,3% | -0,8% |
| 5 | Лос-Анджелес-Феникс | 1542,000 | 59% | 909 780 | 1,8% | -2,4% |
| 6.6 | Сакраменто-Сан-Диего | 849 000 | 82% | 696 180 | 2,2% | -5,2% |
| 7. | Сан-Диего-Сан-Хосе | 766 000 | 74% | 566 840 | 2,1% | -8,2% |
| 8 | Денвер-Лос-Анджелес | 1 286 000 | 47% | 604 420 | 1,3% | -1,3% |
| 9 9 | Сан-Диего-Сан-Франциско | 890 000 | 56% | 498 400 | -0,4% | -6,5% |
| 1010 | Денвер-Феникс | 811 000 | 50% | 405 500 | 2,7% | 0,1% |
| 11. | Лас-Вегас-Сан-Франциско | 884 000 | 43% | 380 120 | 2,0% | 0,2% |
| 12. | Чикаго-Денвер | 842 000 | 47% | 395 740 | 2,9% | 1,6% |
| 13 | Гонолулу-Кахулуи/Мауи | 856000000 | 41% | 350 960 | 5,4% | 1,2% |
| 14 | Чикаго-Феникс | 716 000 | 39% | 279 240 | 1,6% | -0,2% |
| 15 | Орландо - Вашингтон | 958 тысяч | 35% | 335,300 | -0,7% | 0,1% |
| 16 | Чикаго - Вашингтон | 769 000 | 39% | 299,910 | -2,3% | -1,5% |
| 177 | Чикаго-Орландо | 755 000 000 | 35% | 264 250 | 0,5% | 2,9% |
| 18 | Майами - Вашингтон | 838 000 | 30% | 251 400 | -1,3% | -6,4% |
| 19 | Чикаго-Даллас | 705 тысяч | 34% | 239 700 | -0,9% | -0,9% |
| 20 | Даллас-Лос-Анджелес | 701 000 000 | 21% | 147 210 | 0,7% | -0,1% |
1. Лос-Анджелес (LAX) - Сакраменто (SMF)
- Пассажирский объем: 2 133 000
- Доля рынка: 90%
- Юго-западные пассажиры: 1,919,700
- YoY Рост: -3,7%
- 3-летний рост: 1,5%
Southwest Airlines (WN) демонстрирует исключительное доминирование на этом маршруте столицы Калифорнии, перевозя почти 2 миллиона пассажиров в год.
Доля рынка в 90% демонстрирует почти монопольный статус, хотя снижение на -3,7% в годовом исчислении свидетельствует о некотором давлении на рынок. Положительный 3-летний рост указывает на долгосрочную стабильность маршрута, несмотря на недавние проблемы.
2. Лос-Анджелес (LAX) - Сан-Хосе (SJC)
- Пассажирский объем: 1,702 тыс.
- Доля рынка: 84%
- Юго-западные пассажиры: 1,429,680
- YoY Рост: -4,2%
- 3-летний рост: 0,5%
Связь в Силиконовой долине поддерживает высокую производительность, поскольку Юго-Запад перевозит 1,4 миллиона пассажиров.
Доля рынка в 84% отражает доминирующее положение на этом рынке. Несмотря на недавнее снижение (-4,2%), минимальный долгосрочный рост предполагает зрелость рынка.
3. Лос-Анджелес (LAX) - Сан-Франциско (SFO)
- Пассажирский объем: 2 523 000
- Доля рынка: 47%
- Юго-западные пассажиры: 1 185 810
- YoY Рост: -6,5%
- 3-летний рост: -2,4%
Как самый большой маршрут в сети, этот конкурентный коридор сталкивается со значительными проблемами с ежегодным снижением на -6,5%.
Southwest сохраняет сильное присутствие, несмотря на то, что занимает менее половины рынка, что указывает на интенсивную конкуренцию на этом премиальном рынке.
4. Лас-Вегас (LAS) - Лос-Анджелес (LAX)
- Пассажирский объем: 1 994 000
- Доля рынка: 50%
- Юго-западные пассажиры: 997 000
- YoY Рост: -0,8%
- 3-летний рост: 0,3%
Этот маршрут, ориентированный на отдых, демонстрирует замечательную стабильность с минимальным снижением по сравнению с другими основными маршрутами. Сбалансированная доля рынка предполагает эффективное управление конкуренцией, в то время как устойчивый долгосрочный рост указывает на устойчивое положение на рынке.
5. Лос-Анджелес (LAX) — Феникс (PHX)
- Пассажирский объем: 1542,000
- Доля рынка: 59%
- Юго-западные пассажиры: 909 780
- YoY Рост: -2,4%
- 3-летний рост: 1,8%
Ключевая связь с юго-западными рынками показывает умеренный рыночный контроль. Положительный 3-летний рост контрастирует с недавним снижением, что свидетельствует о циклической динамике рынка. Маршрут выигрывает как от делового, так и от досуга.
6. Сакраменто (SMF) - Сан-Диего (SAN)
- Пассажирский объем: 849 000
- Доля рынка: 82%
- Юго-западные пассажиры: 696 180
- YoY Рост: -5,2%
- 3-летний рост: 2,2%
Сильное доминирование на рынке характеризует этот внутрикалифорнийский маршрут. Несмотря на недавнее значительное снижение (-5,2%), положительный долгосрочный рост указывает на базовую силу рынка. Высокая доля рынка демонстрирует эффективные конкурентные барьеры.
7. Сан-Диего (САН) - Сан-Хосе (СЮК)
- Пассажирский объем: 766 000
- Доля рынка: 74%
- Юго-западные пассажиры: 566 840
- YoY Рост: -8,2%
- 3-летний рост: 2,1%
Этот калифорнийский технологический коридор демонстрирует относительно недавнее снижение (-8,2%), несмотря на сильные позиции на рынке.
Контраст между краткосрочным спадом и долгосрочным ростом предполагает возможную реструктуризацию рынка.
8. Денвер (ДЕН) - Лос-Анджелес (ЛАКС)
- Пассажирский объем: 1 286 000
- Доля рынка: 47%
- Юго-западные пассажиры: 604 420
- YoY Рост: -1,3%
- 3-летний рост: 1,3%
Критическое соединение концентратора, показывающее сбалансированные показатели производительности. Умеренная доля рынка отражает конкурентное давление в этом крупном коридоре, в то время как соответствующие темпы роста свидетельствуют о стабильной динамике рынка.
9. Сан-Диего (Сан-Франциско) - Сан-Франциско (СФО)
- Пассажирский объем: 890 000
- Доля рынка: 56%
- Юго-западные пассажиры: 498 400
- YoY Рост: -6,5%
- 3-летний рост: -0,4%
Этот калифорнийский прибрежный маршрут сталкивается со значительными проблемами со снижением показателей во всех временных рамках. Большая часть рынка обеспечивает стратегическое преимущество, несмотря на встречные ветры.
10. Денвер (ДЕН) - Феникс (PHX)
- Пассажирский объем: 811 000
- Доля рынка: 50%
- Юго-западные пассажиры: 405 500
- YoY Рост: 0,1%
- 3-летний рост: 2,7%
Стабильный исполнитель, демонстрирующий положительные тенденции роста. Сбалансированная доля рынка и положительные показатели роста указывают на успешное управление маршрутами и стратегическое позиционирование.
11. Лас-Вегас (LAS) - Сан-Франциско (SFO)
- Пассажирский объем: 884 000
- Доля рынка: 43%
- Юго-западные пассажиры: 380 120
- YoY Рост: 0,2%
- 3-летний рост: 2,0%
Этот смешанный маршрут демонстрирует устойчивый рост, несмотря на конкурентное давление. Снижение доли рынка предполагает возможность расширения этого ценного рынка.
12. Чикаго (MDW) - Денвер (ДЕН)
- Пассажирский объем: 842 000
- Доля рынка: 47%
- Юго-западные пассажиры: 395 740
- YoY Рост: 1,6%
- 3-летний рост: 2,9%
Один из немногих маршрутов, показывающих положительный рост в обоих таймфреймах. Стратегическое соединение хаб-хаб поддерживает стабильную производительность, несмотря на конкурентную среду.
13. Гонолулу (ННЛ) - Кахулуи/Мауи (ОГГ)
- Пассажирский объем: 856000000
- Доля рынка: 41%
- Юго-западные пассажиры: 350 960
- YoY Рост: 1,2%
- 3-летний рост: 5,4%
Лучший маршрут с точки зрения долгосрочного роста (5,4%). Сильные показатели производительности указывают на успешное проникновение на рынок межостровного сервиса Гавайев.
14. Chicago (MDW) - Phoenix (PHX)
- Пассажирский объем: 716 000
- Доля рынка: 39%
- Юго-западные пассажиры: 279 240
- YoY Рост: -0,2%
- 3-летний рост: 1,6%
Умеренные показатели на этом конкурентном трансконтинентальном маршруте. Снижение доли рынка отражает многократную конкуренцию перевозчиков в этом крупном коридоре.
15. Орландо (MCO) - Вашингтон (DCA/IAD)
- Пассажирский объем: 958 тысяч
- Доля рынка: 35%
- Юго-западные пассажиры: 335,300
- YoY Рост: 0,1%
- 3-летний рост: -0,7%
Смешанное выступление в коридоре Восточного побережья. Снижение доли рынка свидетельствует о сильной конкуренции, в то время как недавняя стабильность предполагает эффективное позиционирование рынка.
16. Чикаго (MDW) - Вашингтон (DCA/IAD)
- Пассажирский объем: 769 000
- Доля рынка: 39%
- Юго-западные пассажиры: 299,910
- YoY Рост: -1,5%
- 3-летний рост: -2,3%
Сложные показатели производительности в обоих таймфреймах. Тяжелый для бизнеса маршрут сталкивается с конкурентным давлением в важном коридоре Восточное побережье-Средний Запад.
17. Чикаго (MDW) - Орландо (MCO)
- Пассажирский объем: 755 000 000
- Доля рынка: 35%
- Юго-западные пассажиры: 264 250
- YoY Рост: 2,9%
- 3-летний рост: 0,5%
Сильный недавний рост на этом маршруте, ориентированном на отдых. Более низкая доля рынка предполагает возможность расширения на этом растущем рынке.
18. Майами (MIA) - Вашингтон (DCA/IAD)
- Пассажирский объем: 838 000
- Доля рынка: 30%
- Юго-западные пассажиры: 251 400
- YoY Рост: -6,4%
- 3-летний рост: -1,3%
Существенные проблемы в этом конкурентном коридоре Восточного побережья. Низкая доля рынка и негативные тенденции роста указывают на необходимость стратегического пересмотра.
19. Чикаго (MDW) - Даллас (DAL)
- Пассажирский объем: 705 тысяч
- Доля рынка: 34%
- Юго-западные пассажиры: 239 700
- YoY Рост: -0,9%
- 3-летний рост: -0,9%
Постоянные отрицательные темпы роста указывают на структурные проблемы. Снижение доли рынка отражает интенсивную конкуренцию в этом крупном деловом коридоре.
20. Даллас (DAL) - Лос-Анджелес (LAX)
- Пассажирский объем: 701 000 000
- Доля рынка: 21%
- Юго-западные пассажиры: 147 210
- YoY Рост: -0,1%
- 3-летний рост: 0,7%
Самая низкая доля рынка в топ-20 самых загруженных маршрутов Юго-Запада указывает на значительные конкурентные проблемы. Небольшое недавнее снижение контрастирует с небольшим долгосрочным ростом, что свидетельствует о стабильности рынка, несмотря на конкурентное давление.
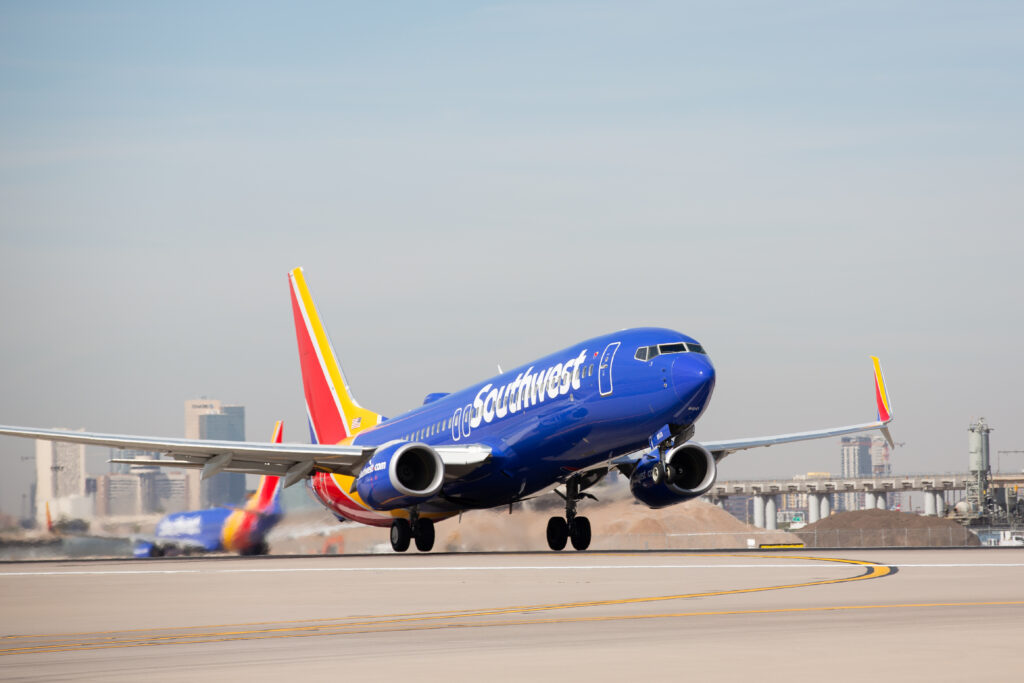
 Фото: Southwest Airlines
 Анализ эффективности рынка
Региональные сильные стороны
- Калифорнийское доминирование: Юго-Запад занимает более 80% рынка на ключевых внутрикалифорнийских маршрутах
- Западный фокус: Семь из 10 лучших маршрутов соединяют города США
- Hub Performance: Лос-Анджелес входит в топ-20 7 маршрутов
Паттерны роста
- Позитивные исполнители: Только 8 маршрутов показывают положительный 3-летний рост
- Самый сильный рост: Гонолулу-Кахулуи/Мауи (+5,4% за 3 года)
- Самые глубокие спады: Сан-Диего-Сан-Хосе (8,2% за 12 месяцев)
Анализ рыночной доли
- Самый высокий: LAX-SMF (90%)
- Самый низкий: «Даллас-Лос-Анджелес» (21%)
- Средняя доля рынка: 52% на 20 лучших маршрутах
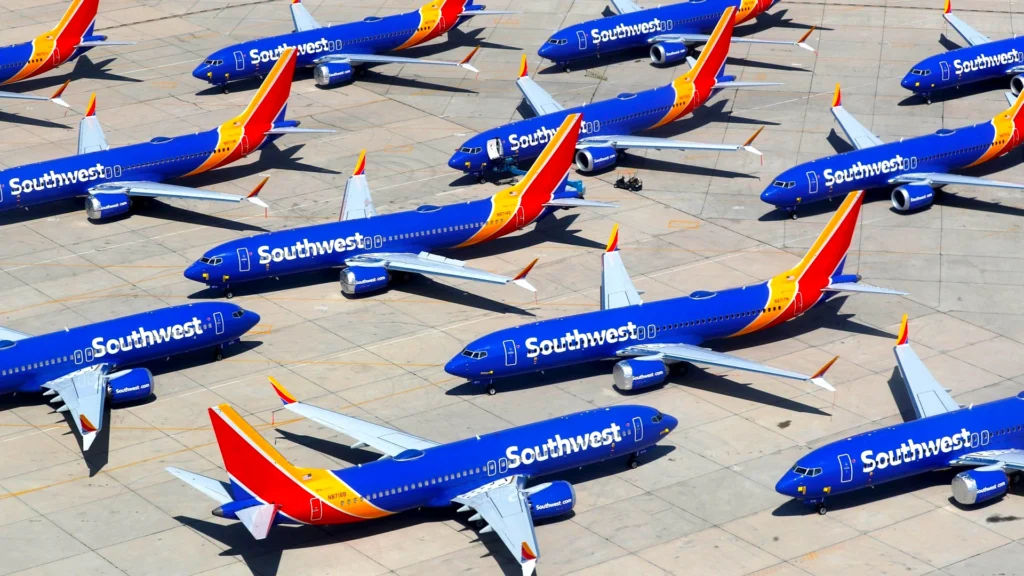
 Фото: ur-1988 | Кредиты Создателю
Производительность категорий маршрутов
Досуговые маршруты
- Гавайские маршруты демонстрируют устойчивость к положительному росту
- Связи Лас-Вегаса поддерживают стабильные доли рынка
- Маршруты Флориды демонстрируют смешанную производительность
Бизнес-маршруты
- Чикагские связи показывают разную производительность
- Калифорнийские бизнес-коридоры сохраняют высокую долю рынка, несмотря на снижение трафика
- Маршруты Денверского хаба демонстрируют стабильность
Сетевые последствия
Данные указывают на стратегическую направленность Southwest на поддержание сильных позиций на основных западных рынках при одновременном управлении потенциалом в более широкой сети.
Преимущественно негативные тенденции роста указывают на продолжающиеся корректировки рынка, особенно в конкурентных коридорах.
Оставайтесь с нами. Следуйте за нами в социальных сетях для последних обновлений.
Присоединяйтесь к нам в Telegram Group для последних обновлений авиации. Следуйте за нами в Google News
Доходы авиакомпаний American, Delta, Southwest и United Airlines в 2024 году
Топ-20 самых оживленных маршрутов Southwest Airlines впервые появился на Aviation A2Z.


![Sąd: Mieszkanie 191.500 zł. Zachowki 31.916,66 zł i 10.638,88 zł. Obliczenia. Wzory [Przykład]](https://g.infor.pl/p/_files/38265000/podwyzki-38264590.jpg)


