

Международный совет аэропортов (ACI) World опубликовал свой эксклюзивный первый взгляд на рейтинг самых загруженных аэропортов мира в 2024 году, при этом международный аэропорт Хартсфилд-Джексон Атланта (ATL) сохраняет свою лидирующую позицию, за ним следуют международный аэропорт Дубая (DXB) и международный аэропорт Даллас Форт-Уэрт (DFW).
Несмотря на геополитические и экономические проблемы, эти авиационные центры продемонстрировали замечательную устойчивость, коллективно обработав около 855 миллионов пассажиров в 2024 году. Аэропорт Стамбула (IST) занял 7-е место с более чем 80 миллионами пассажиров, показав впечатляющий рост на 53,4% по сравнению с уровнями 2019 года.
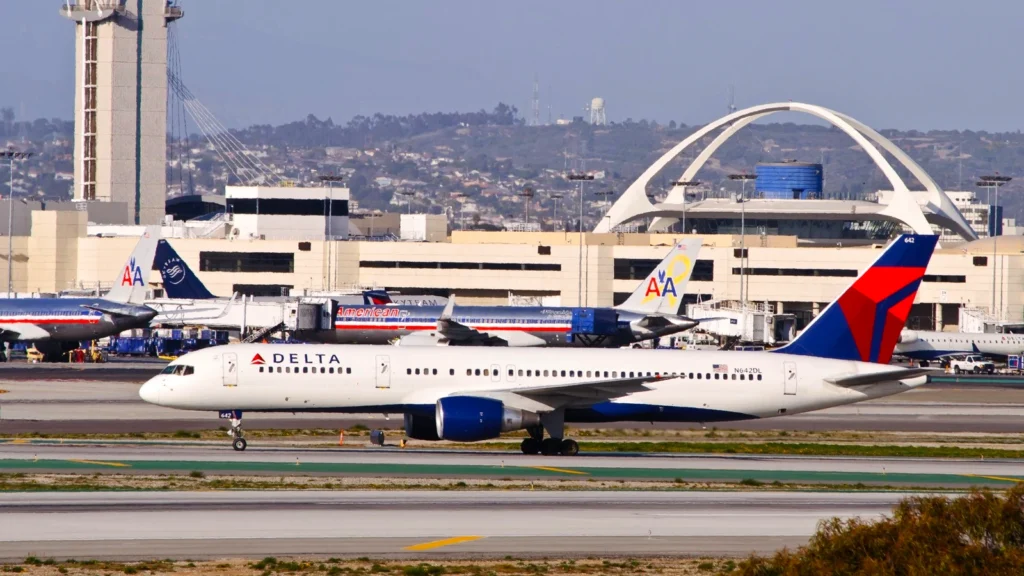 Фото: Scarlet Sappho | Flickr
Самый большой аэропорт в мире 2024
Предварительные данные ACI World показывают, что глобальный пассажиропоток в 2024 году достиг почти 5 миллиардов, что на 9% больше по сравнению с 2023 годом и на 3,8% больше по сравнению с уровнями до пандемии 2019 года.
Топ-10 самых загруженных аэропортов, на которые приходится 9% мирового трафика, показали впечатляющий рост на 8,8% с 2023 года и увеличение на 8,4% по сравнению с результатами 2019 года в 789 миллионов пассажиров.
«На фоне глобальных вызовов сияет устойчивость самых загруженных аэропортов мира», - сказал генеральный директор ACI Джастин Эрбаччи.
Эти центры являются жизненно важными артериями торговли, торговли и связи. По мере роста авиаперевозок ACI World готова поддерживать своих членов, обеспечивая плавный поток людей и товаров, которые способствуют глобальному экономическому, социальному и культурному прогрессу. "
Генеральный директор ACI World Джастин Эрбаччи
Рейтинг 2024 года показывает некоторые заметные движения среди самых загруженных аэропортов мира:
- Международный аэропорт Хартсфилд-Джексон Атланта (ATL) занял первое место с 108 миллионами пассажиров
- Международный аэропорт Дубая (DXB) сохранил второе место с 92,3 млн пассажиров
- Международный аэропорт Даллас Форт-Уэрт (DFW) поднялся на третье место с 10-го в 2019 году
- Токийский аэропорт Ханэда (HND) стабильно удерживается в топ-5
- Лондонский аэропорт Хитроу (LHR) поднялся на одно место с 2023 года
Возможно, самым резким ростом стал Шанхайский международный аэропорт Пудун (PVG), который поднялся с 21-й позиции в 2023 году до 10-й в 2024 году, показав замечательный рост на 41% по сравнению с аналогичным периодом прошлого года. Этот скачок был вызван расширением визовой политики, возобновлением международных рейсов, улучшением операционной деятельности и более широким восстановлением Китая в Азиатско-Тихоокеанском регионе.
| 1 1 | 1 1 | 1 1 | ATLANTA, США (ATL) | 108 067 766 | 3.3 | -2.2 |
| 2 2 | 2 2 | 4.4 | Дубай, ОАЭ (DXB) | 92 331 506 | 6.1.1 | 6.9.9 |
| 3 | 3 | 1010 | Даллас/Форт-Уэрт, США (DFW) | 87 817 864 | 7.4.4 | 17.0 |
| 4.4 | 5 | 5 | Токио, Япония (HND) | 85 900 617 | 9.1.1 | 0,5 |
| 5 | 4.4 | 7. | Лондон, Великобритания (LHR) | 83 884 572 | 5.9 | 3.7 |
| 6.6 | 6.6 | 16 | Денвер, США (DEN) | 82 358 744 | 5.8.8 | 19.3.3 |
| 7. | 7. | 28 | СТАМБУЛ, ТЮРКЕЙ (IST) | 80 073 252 | 5.3.3 | 53.4.4 |
| 8 | 8 | 6.6 | Чикаго, США (ORD) | 80 043 050 | 8.3.3 | -5.4 |
| 9 9 | 1010 | 177 | НЬЮ-ДЕЛИ, Индия (ДЕЛЬ) | 77 820 834 | 7.8.8 | 13.6.6 |
| 1010 | 21 | 8 | Шанхай, Китай (ПВГ) | 76 787 039 | 41.0 | 0,8 |
Примечание: Полные газораспределяющие и депланируемые газораспределяющие в транзитном соединении
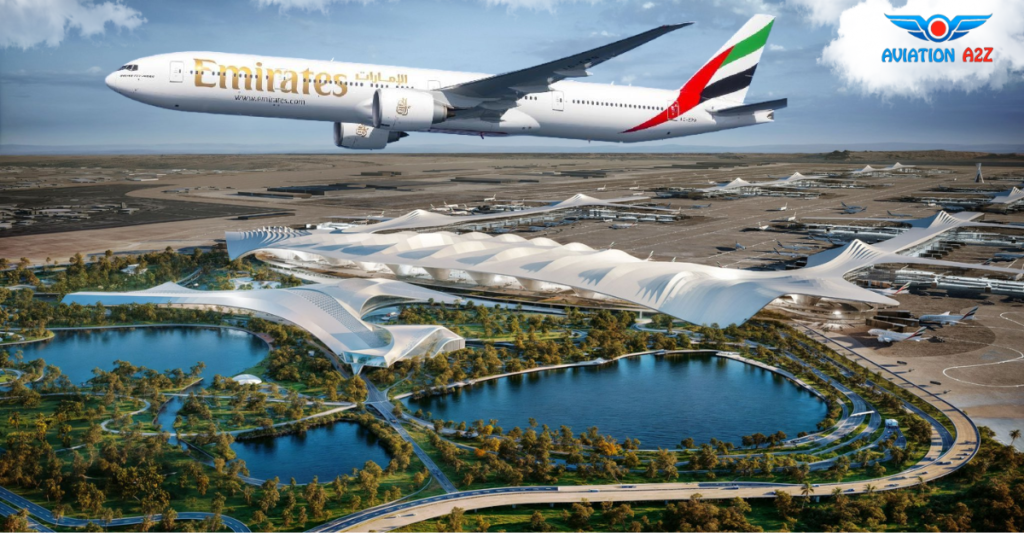 Изображение: Aviation A2Z
Крупнейший международный Аэропорты в 2024 году
Если смотреть конкретно на международные пассажирские перевозки, Дубай (DXB) сохраняет свое доминирующее положение в качестве самого загруженного международного центра в мире с 92,3 миллионами международных пассажиров.
Лондонский аэропорт Хитроу (LHR) занял второе место, а международный аэропорт Инчхон (ICN) в Корее совершил значительный скачок с 7-й на 3-ю позицию с увеличением на 26,7% по сравнению с 2023 годом.
Аэропорт Стамбула (IST) продолжает впечатляющую траекторию роста, занимая 7-е место по международному трафику с почти 63 миллионами международных пассажиров - на 59,1% больше по сравнению с 2019 годом. Этот замечательный результат подчеркивает стратегическую позицию Турции как глобального связующего центра между Европой, Азией и Африкой.
| 1 1 | 1 1 | 1 1 | Дубай, ОАЭ (DXB) | 92 331 506 | 6.1.1 | 7.0 |
| 2 2 | 2 2 | 2 2 | Лондон, Великобритания (LHR) | 79 194 330 | 5.7.7 | 4.1.1 |
| 3 | 7. | 5 | INCHEON, KOREA (ICN) | 70 669 246 | 26,7 | 0,1 |
| 4.4 | 5 | 7. | СИНГАПУР, СИНГАПУР (SIN) | 67 063 000 | 14.8 | -0,8 |
| 5 | 3 | 3 | AMSTERDAM, NL (AMS) | 66 822 849 | 8.0 | - 6.8 |
| 6.6 | 4.4 | 6.6 | Париж, Франция (CDG) | 64 469 356 | 5.0 | - 7.7 |
| 7. | 6.6 | 14 | СТАМБУЛ, ТЮРКЕЙ (IST) | 62 975 429 | 8.1.1 | 59.1.1 |
| 8 | 8 | 8 | Франкфурт, Германия (ФРА) | 56 185 219 | 3.9 | -10.9 |
| 9 9 | 12. | 4.4 | HONG KONG, HONG KONG SAR (HKG) | 52 949 047 | 34.4.4 | - 25,7 |
| 1010 | 9 9 | 15 | Доха, Катар (DOH) | 52 714 976 | 14.8 | 35,9 |
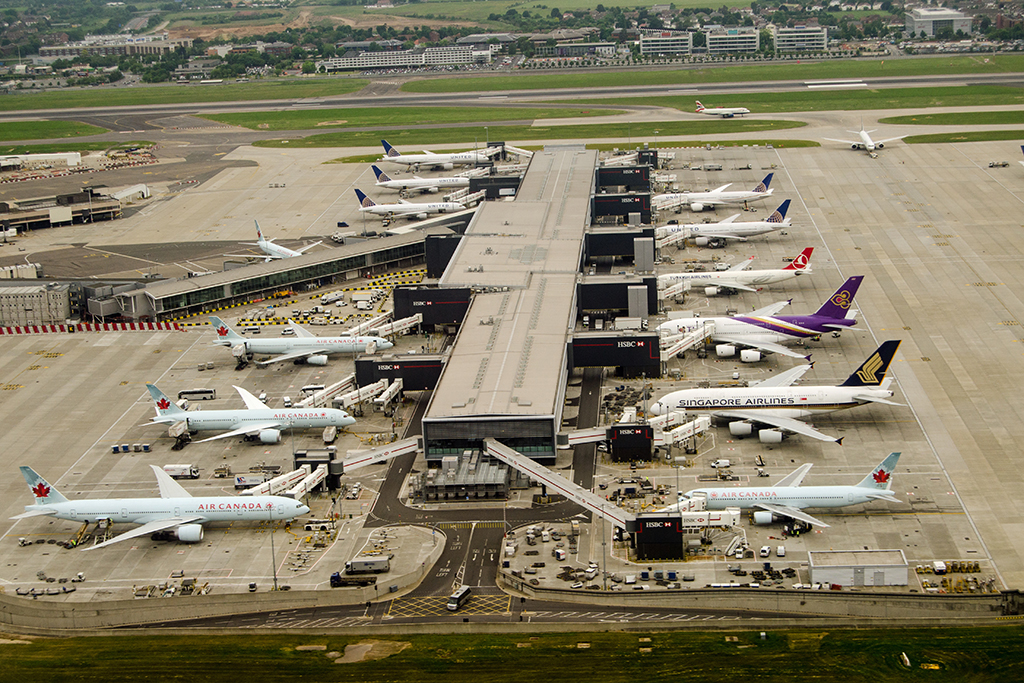 Изображение: Ferrovial Construction
Проблемы и перспективы будущего
В 2024 году авиационная промышленность столкнулась со значительными препятствиями, включая проблемы с цепочками поставок от производителей самолетов, геополитическую напряженность, затрагивающую маршруты полетов, и увеличение эксплуатационных расходов. Несмотря на эти препятствия, спрос на пассажиров оставался устойчивым, хотя ожидается, что в 2025 году рост будет умеренным.
АСИ Мир прогнозирует, что глобальный пассажиропоток достигнет 9,9 миллиарда в 2025 году, что составляет 4,8% в годовом исчислении. Этот переход от восстановительных скачков к более структурным, долгосрочным тенденциям роста потребует от аэропортовой отрасли сосредоточиться на:
- Финансовая жизнеспособность и устойчивые потоки доходов
- Стратегические инвестиции в инфраструктуру для решения проблем, связанных с ограниченным потенциалом
- Повышение оперативной эффективности
- Инициативы в области экологической устойчивости
 Источник: Cathay Pacific
Самые большие грузовые аэропорты в мире
Международный аэропорт Гонконга (HKG) занял первое место по грузоперевозкам с впечатляющими показателями роста.
Тенденция восстановления была последовательной в большинстве крупных аэропортов, когда количество пассажиров приближалось к допандемийному уровню, а объемы грузов значительно превысили показатели 2019 года.
Объемы воздушных грузов увеличились на 8,4% в годовом исчислении в 2024 году, достигнув более 124 миллионов метрических тонн во всем мире. Это на 3,9% больше по сравнению с показателями 2019 года, демонстрируя, что грузовой сектор не только восстановился, но и расширился за пределы допандемического уровня.
Топ-10 грузовых аэропортов обработали около 32,3 млн тонн в 2024 году, что составляет почти 26% мировых объемов. В этих ведущих аэропортах общий рост составил 9,3% по сравнению с 2023 годом и 9,5% по сравнению с результатами 2019 года.
Международный аэропорт Гонконга (HKG) сохранил свою лидирующую позицию, за ним следуют международный аэропорт Шанхай Пудун (PVG) и международный аэропорт Мемфис (MEM), глобальный центр FedEx Express (FX).
| 1 1 | 1 1 | 1 1 | Гонконг, Гонконг SAR (HKG) | 4 938 211 | 14.1.1 | 2.7 |
| 2 2 | 3 | 3 | Шанхай, Китай (PVG) | 3 778 331 | 9.8.8 | 4.0 |
| 3 | 2 2 | 2 2 | Мемфис, США (MEM) | 3 754 236 | 3,3 | -13.2 |
| 4.4 | 4.4 | 6.6 | Анкоридж, США (ANC*) | 3 699 284 | 9.4.4 | 34,7 |
| 5 | 6.6 | 4.4 | Луисвилл, США (SDF) | 3 152 969 | 15.6.6 | 13.0 |
| 6.6 | 5 | 5 | Инчхон, Корея (ICN) | 2 946 902 | 7.4.4 | 6.6.6 |
| 7. | 7. | 12. | Майами, США (MIA) | 2 753 450 | 9.0 | 31,6 |
| 8 | 8 | 8 | Доха, Катар (DOH) | 2 616 849 | 11.1.1 | 18.1.1 |
| 9 9 | 9 9 | 177 | Гуанчжоу, Китай (CAN) | 2 373 727 | 16,9 | 23.6. |
| 1010 | 1010 | 9 9 | Тайбэй, Тайвань (TPE) | 2 270 974 | 7,5 | 4.1.1 |
Примечание: Включает транзитные грузы
Несколько ключевых факторов привели к этому исключительному росту грузов:
- Взрывной спрос на электронную коммерцию во всем мире
- Постоянные сбои в морском судоходстве
- Снижение цен на авиатопливо улучшает операционную экономику
- Стратегии диверсификации цепочек поставок
- Увеличение инвестиций в специализированные грузовые объекты
Крупные грузовые перевозчики, такие как FedEx (FX), UPS (5X) и DHL (D0), расширили свой флот и операции для удовлетворения этого повышенного спроса.
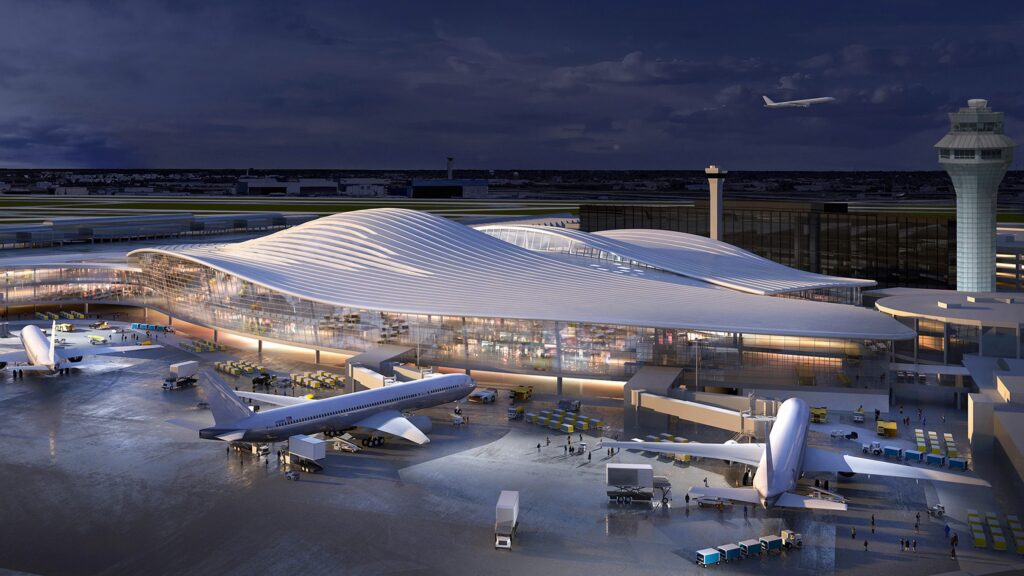 Фото: Fentress-EXP-brook-Garza
Движения самолетов и эксплуатационная эффективность
Глобальные перемещения самолетов достигли примерно 100 миллионов в 2024 году, что на 4,3% больше, чем в 2023 году, но все еще немного ниже показателей 2019 года с коэффициентом восстановления 97,4%.
В топ-10 аэропортов для перемещения воздушных судов, представляющих более 6% мирового трафика с 6,4 миллионами перемещений, наблюдался рост на 6,5% с 2023 года и незначительный прирост на 0,4% по сравнению с 2019 годом.
Международный аэропорт Хартсфилд-Джексон Атланта (ATL) возглавляет эту категорию, за ним следуют международный аэропорт Чикаго О'Хара (ORD) и международный аэропорт Даллас Форт-Уэрт (DFW). В этих аэропортах были приняты различные меры по повышению эффективности, чтобы справиться с увеличением трафика при управлении ограничениями на слоты:
- Передовые системы управления воздушным движением
- Совершенствование процедур наземного обслуживания
- Технологии оптимизации Gate
- Стратегии максимизации использования ВПП
- Системы смягчения воздействия на погоду
Авиакомпании, работающие в этих центрах, в том числе American Airlines (AA) в DFW и United Airlines (UA) в ORD, скорректировали свои методы планирования для повышения эксплуатационной надежности и снижения заторов в пиковые периоды.
| 1 1 | 1 1 | 2 2 | Атланта, США (ATL) | 796,224 | 2.6 | -12.0 |
| 2 2 | 2 2 | 1 1 | Чикаго, США (ORD) | 776 036 | 7.7.7 | -15.6 |
| 3 | 3 | 3 | Даллас/Форт-Уэрт, США (DFW) | 743 203 | 7.8.8 | 3.2.2 |
| 4.4 | 4.4 | 5 | Денвер, США (DEN) | 689,368 | 4.9 | 9.1.1 |
| 5 | 5 | 8 | Лас-Вегас, США (LAS) | 613 973 | 0,4 | 11.0 |
| 6.6 | 7. | 7. | Шарлотта, США (CLT) | 596 583 | 10,7 | 3.2.2 |
| 7. | 6.6 | 4.4 | Лос-Анджелес, США (LAX) | 581,779 | 1.2.2 | -15.8 |
| 8 | 18 | 11. | Шанхай, Китай (PVG) | 528 074 | 21.7 | 3.2.2 |
| 9 9 | 8 | 54 | Стамбул, Турция (IST) | 517 284 | 2.2.2 | 56,8 |
| 1010 | 14 | 12. | Гуанчжоу, Китай (CAN) | 512,004 | 12.3 | 4.2.2 |
Примечание: Движения представляют собой посадки и взлеты
Оставайтесь с нами. Следуйте за нами в социальных сетях для последних обновлений.
Присоединяйтесь к нам в Telegram Group для последних обновлений авиации. Следуйте за нами в Google News
Сингапурский аэропорт Чанги назван лучшим в мире, No6 удивит вас
Самые большие аэропорты в мире 2024 No7 удивят Впервые появился на Aviation A2Z.


![Awanse, odznaczenia, medale i… zaskakujący film. Wyjątkowe Święto Policji w Płocku [FILM] [FOTO]](https://dziennikplocki.pl/wp-content/uploads/2026/07/276-255710-Medium.jpg)

